
Inspired by a forum post on mybroadband, I decided to dig into my history books and pull out what the old electricity tariffs were.
It turns out that a house that was paying R500 per month in 2008, will be paying R2000 in 2018, but surprisingly it’s not always been price increases ever year.
The graph is based on the Eskom Homelight 60A tariff – this is a pretty standard tariff for anyone not getting Free Basic Electricity units who’s on prepaid and who’s connected directly to Eskom. I know most of you are connected via your municipality who can charge very different rates – if you want me to do something similar for your municipality, give me a shout-out in the comments box below. I’ve done the numbers in the graph based on buying 1000 kWh each and every month. Again, this is actually a best-case, as most people — well, people without a Homebug! — will buy more in Winter than Summer… it’s a much better idea to ‘smooth’ your buying out over the year, but that’s another article.
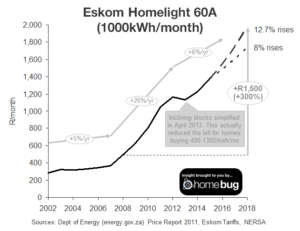
There appears to be 3 phases of tariff increases. From 2002 to 2007, tariff increases were ‘reasonable’ at an average of 5-6% each year. Then suddenly (and just as the world recession hit!) prices started shooting up, from 2008-12 prices increased on average by 26% each and every year. This took the example household from around R500 per month to around R1100 each month in the space of 4 years!
In 2012 prices actually reduced a little. A simplification of inclining block structure (from 4 blocks down to 2) actually decreasing prices slightly for our example family from R1160 each month in 2012 to just under R1130 in 2013. In fact it reduced the total paid for anyone using between 400 and 1500 kWh; those using less than 400kWh were hit, but they may also qualify for free-basic units and therefore may be on a different tariff. If our example house was using 2000 kWh each month they would still see an increase – from around R2550 each month in 2012 to R2640 in 2013 – around 3%.
That brings us into 2014/15 – which is the current cycle and is with all Eskom customers until April 2015. We saw an 8% price rise coming into this year, which was meant to be kept for 5 years. Instead, Eskom has struggled and strained and managed to squeeze next year’s price rise to 12.7%. If that price rise keeps going, our example household will be paying just under R2000 each and every month by 2018.
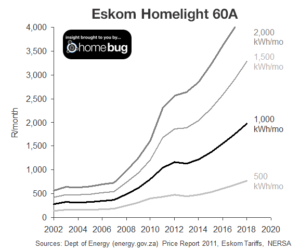
While we’re at it, I thought it might be an idea to do the same graphs for people using different amounts each month. Unfortunately, these are only estimates, because I don’t have all the detail of the old tariffs, only estimates for using 1000 kWh/month — so going back before 2008 these numbers might be wrong. Here it is anyway!
If you’d like me to do a similar thing for your local municipality, let me know. I think I can probably do something for Cape Town (because I’ve got some of the old tariffs), but if you want another one, you’ll have to help me find the old tariffs! Please use the comment below area to ask!
Finally a thanks to Greylor of mybb for inspiring this. I hope this helps and you find it useful 🙂
All the information has been gathered from the following official sources:
For the older stuff – department of Energy: http://www.energy.gov.za/files/media/explained/2011EnergyPrice%20Report_new.pdf
For the more recent tariffs, Eskom themselves:
2010: http://www.eskom.co.za/CustomerCare/TariffsAndCharges/Documents/FAQs_April20101.pdf
2011: – based on something in the 2012 report saying that prices went up 11.08% – so took 2012 and divided by 1.1108
2012: http://www.eskom.co.za/CustomerCare/TariffsAndCharges/Documents/ESKOM%20TC%20BOOKLET%202012-13%20FINAL%203.pdf
2013: http://www.eskom.co.za/CustomerCare/TariffsAndCharges/Documents/Inclining_bock_rate_tariffs_13.pdf
2014: http://www.eskom.co.za/CustomerCare/TariffsAndCharges/Documents/ScheduleStdPrices2014_15.pdf
And finally for the ‘future’ this is based on various press releases by NERSA – e.g:
http://www.cnbcafrica.com/news/resources/2014/10/03/south-africa-nersa-energy-regulator-price-hike/
Leave a Reply