

You might think it’s impossible to reduce your tariff – and in some ways you’re probably right. Whoever connects your electricity will supply it your home forever. If you’ve recently de-emigrated from the UK, you might be relieved by not having to change suppliers every year to get the best deal. If you want a choice in supplier you’ll have to move home – and that’s a little drastic even for the biggest homebugs! But that doesn’t mean you can’t save serious amounts of Rand by making sure you get on the right tariff for you!
[note, some of the numbers in this article are now out of date… the message is still the same, but with tariffs changing every year the numbers will have changed]
It doesn’t hurt to be aware that different suppliers can charge very different rates, for example – in Cape Town there’s a split between the North and South — the North is largely provided directly by Eskom, whereas the South and Central districts are mainly provided by the Municipality. For a standard suburban house using 1,000kWh per month an Eskom billed customer will pay R1,240, whereas as City of Cape Town customer will pay R1,550 – more than R300 0r 25% more. All you can really do is ask your municipality why it charges so much and see if they can make reductions. In Durban this year the annual increase was cut from 8% down to 5.5% (yes, we know it’s not much – but 2% is still around R400 per year for a typical household).
But that’s not the end of it, although you might not be able to change your supplier, there are a few practical ways of reducing your tariff, without moving home. These are:
- Lower usage = lower cost per unit
- Maximise your blocks by timing purchases (prepaid users only!)
- Change your supply – downsize or prepay (works in very limited cases!)
- Claim the right tariff and any entitlements
Before we go into each of these, it’s important to understand what your tariff is and how it compares to others. To begin with there’s a little explaining to do about how Inclining Block Tariffs work.
What is an Inclining block tariff?
Pretty much every home in South Africa is on an ‘inclining block tariff’ or IBT for short. This means that as you use MORE electricity you pay MORE for each unit too. If you increase your consumption you pay twice – once for the extra power and again for the higher cost per unit. This also works in reverse – as you reduce your consumption you get the ‘double-whammy’ of fewer units AND lower cost per unit. The point of this system is to encourage you to use less electricity, but for many people it just means they are very confused.
Looking across the larger municipalities it seems there aren’t any national level rules as to when the blocks start and end or how many blocks there can be (although I believe NERSA is trying to enforce a one-block rule).
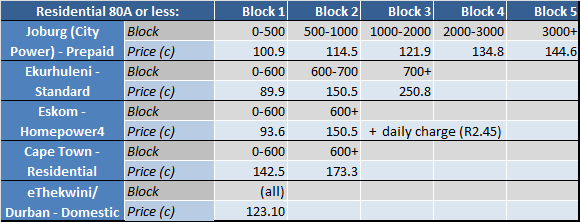
As an explanation of how inclining block tariffs work let’s use an example from the table on the right – Johannesburg City Power prepaid tariff. City Power unfortunately has the most blocks of any of the large municipalities – with 5 different charging blocks. Depending on how much you’ve already used (or for prepaid customers, bought!) during the last month the cost of an additional unit of electricity changes. Our example person will buy R400 each Friday in July.
- 5th July: Buy R400 worth of prepaid credit – get 396.6 credits all in Block 1 (R400 divided by R1.009 per unit)
- 12th July: Running low on power, so buy another R400 worth of credit. Get to buy the first 103.4 credits in Block 1 (which cost R104.28 –> 103.4 x 1.009) and then spend the rest of the money (R295.72) in Block 2, buying 258.3 credits (R295.72 divided by R1.145 per unit)
- 19th July: I’m running low again, so this time I buy another R400 of credit – again the payment crosses two blocks, the remaining space in Block 2 (241.7 units left costing R276.62) with the remaining R123.38 going into Block 3 buying 101.2 units (at a cost of 121.9c per unit)
- 26th July: Top up another R400. This time though there is enough space in Block 3 — the block from 1000 to 2000 units; where only 101.2 units have been used so far! R400 pays for 328.2 units at R1.219 each unit. There remain 570.6 units in Block 3 unused.
- … the next Friday is August 2nd – so I’m back at the start of Block 1
When prepaying, other amounts (like unpaid previous bills or daily charges) are taken off the amount that can be spent on credit – for example, with a R4/day charge, a R400 top-up each week would have R28 taken off before the remaining R372 is spent on credit as above.
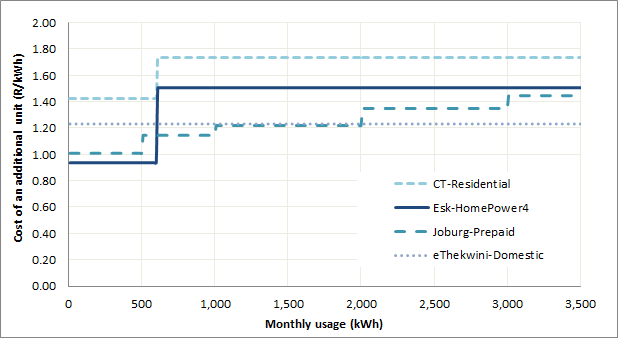
Just looking at a few inclining blocks on a graph you can see what a difference who your connection is from can make but also how your personal usage affects whether your municipality is more or less expensive than another. For example, City Power (Jo’burg) Domestic Prepaid is more expensive than Eskom HomePower4 tariff for the first 600kWh, but then is cheaper right up to very high usage levels.
We’ve put together the largest municipality domestic tariffs into a spreadsheet for you to compare. You can download it here –> Block Tariff Model Aug13.
These inclining blocks can seem very complicated, but they do lead to some opportunities for cost-saving – by cutting your usage at the right times, timing your purchases. We’ll explain more in other posts.
We’ve made a little spreadsheet for any energy-geeks out there to see how their tariff compares with other residential tariffs within the municipality and outside it. You can download it here –> Block Tariff Model Aug13. We’re working on a the Google sheets version for those of you without Excel…
How to use the Homebug comparison tool
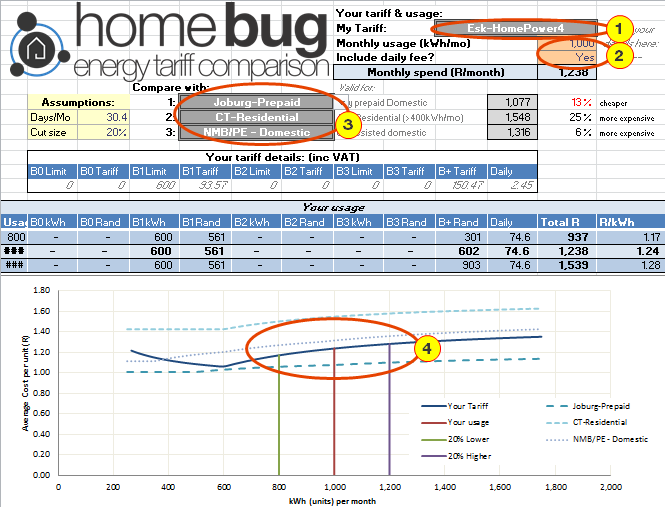
To use the spreadsheet just download it and open it in Excel. Next select your tariff from the list (1) (please contact us/comment if we don’t have your tariff) and enter your typical monthly usage in kWh below (2). You also need to chose whether you compare tariffs with or without ‘daily’ fees – only a few tariffs have daily fees, so sometimes comparisons can be better without. Finally select which tariffs you’d like to compare with (see 3). Once you’ve selected these you can see your results in the graph at the bottom.
In the screen shot on the right, we can see that if we lived in Jo’burg and Prepaid we’d be paying 13% less than we currently are on our Eskom HomePower4 tariff. Looking at the graph (4) we can see that if our usage was only 600kWh per month the difference would be much smaller. Furthermore we can see that Eskom’s tariff is much than the tariffs in Nelson Mandela Bay (Port Elizabeth) but the difference gets smaller if we used much more or much less electricity. In fact if we used less than 400kWh per month, because of the daily fee on HomePower4 (R2.45/day inc VAT), we’d be paying more with Eskom than with the NMB tariff. Finally we can see that City of Cape Town is pretty much always more expensive…
We’d love to hear of any interesting things you find out or if you think we’ve got anything wrong. We’re more than happy to admit we got things wrong and updated our data.
Please let us know if you’d like us to add more tariffs — it would be really handy if you could tell us where on the web we can find the information and which tariff you personally on are – e.g. Johannesburg City Power Domestic 1 Phase 60A: http://www.joburg.org.za/images/stories/2013/July/cp%201314fy%20tariffs%20-%20annexure%20a.pdf
Leave a Reply